Although known to Arab and Malay sailors as early as the 10th century, Mauritius was first explored by the Portuguese in the 16th century and subsequently settled by the Dutch – who named it in honor of Prince Maurits van NASSAU – in the 17th century.
The French assumed control in 1715, developing the island into an important naval base overseeing Indian Ocean trade, and establishing a plantation economy of sugar cane. The British captured the island in 1810, during the Napoleonic Wars. Mauritius remained a strategically important British naval base, and later an air station, playing an important role during World War II for anti-submarine and convoy operations, as well as the collection of signals intelligence. Independence from the UK was attained in 1968.
A stable democracy with regular free elections and a positive human rights record, the country has attracted considerable foreign investment and has one of Africa’s highest per capita incomes.
Since independence in 1968, Mauritius has undergone a remarkable economic transformation from a low-income, agriculturally based economy to a diversified, upper middle-income economy with growing industrial, financial, and tourist sectors. Mauritius has achieved steady and strong growth over the last several decades, resulting in more equitable income distribution, increased life expectancy, lowered infant mortality, and a much-improved infrastructure.
The economy rests on sugar, tourism, textiles and apparel, and financial services, and is expanding into fish processing, information and communications technology, and hospitality and property development. Sugarcane is grown on about 90% of the cultivated land area and accounts for 15% of export earnings. The government’s development strategy centers on creating vertical and horizontal clusters of development in these sectors. Mauritius has attracted more than 32,000 offshore entities, many aimed at commerce in India, South Africa, and China.
Investment in the banking sector alone has reached over $1 billion. Mauritius, with its strong textile sector, has taken advantage of the Africa Growth and Opportunity Act, with Mauritian exports to the US growing by 400% from 2001-2012. Mauritius’ sound economic policies and prudent banking practices helped to mitigate negative effects of the global financial crisis in 2008-09. GDP grew in the 3-4% per year range in 2010-14, and the country continues to expand its trade and investment outreach around the globe.
GDP (purchasing power parity):
$23.42 billion (2014 est.)
$22.67 billion (2013 est.)
$21.97 billion (2012 est.)
note: data are in 2014 US dollars
* country comparison to the world: 138
GDP (official exchange rate):
$12.72 billion (2014 est.)
GDP – real growth rate:
3.3% (2014 est.)
3.2% (2013 est.)
3.2% (2012 est.)
* country comparison to the world: 97
GDP – per capita (PPP):
$17,900 (2014 est.)
$17,400 (2013 est.)
$16,900 (2012 est.)
note: data are in 2013 US dollars
* country comparison to the world: 91
Gross national saving:
14% of GDP (2014 est.)
13.4% of GDP (2013 est.)
17.5% of GDP (2012 est.)
* country comparison to the world: 119
GDP – composition, by end use:
household consumption: 73.4%
government consumption: 14.4%
investment in fixed capital: 21.2%
investment in inventories: 2.8%
exports of goods and services: 55.4%
imports of goods and services: -67.2%
(2014 est.)
GDP – composition, by sector of origin:
agriculture: 4.5%
industry: 22.4%
services: 73.2%
(2014 est.)
Agriculture – products:
sugarcane, tea, corn, potatoes, bananas, pulses; cattle, goats; fish
Industries:
food processing (largely sugar milling), textiles, clothing, mining, chemicals, metal products, transport equipment, nonelectrical machinery, tourism
Industrial production growth rate:
0.4% (2014 est.)
* country comparison to the world: 165
Labor force:
600,200 (2014 est.)
* country comparison to the world: 157
Labor force – by occupation:
agriculture and fishing: 9%
construction and industry: 30%
transportation and communication: 7%
trade, restaurants, hotels: 22%
finance: 6%
other services: 25% (2007)
Unemployment rate:
8% (2014 est.)
8% (2013 est.)
* country comparison to the world: 91
Population below poverty line:
8% (2006 est.)
Household income or consumption by percentage share:
lowest 10%: NA%
highest 10%: NA%
Distribution of family income – Gini index:
39 (2006 est.)
37 (1987 est.)
* country comparison to the world: 69
Budget:
revenues: $2.797 billion
expenditures: $3.263 billion (2014 est.)
Taxes and other revenues:
22% of GDP (2014 est.)
* country comparison to the world: 146
Budget surplus (+) or deficit (-):
-3.7% of GDP (2014 est.)
* country comparison to the world: 134
Public debt:
61.4% of GDP (2014 est.)
60% of GDP (2013 est.)
* country comparison to the world: 52
Fiscal year:
1 July – 30 June
Inflation rate (consumer prices):
3.9% (2014 est.)
3.5% (2013 est.)
Central bank discount rate:
9% (31 December 2010)
* country comparison to the world: 31
Commercial bank prime lending rate:
8.7% (31 December 2014 est.)
8.5% (31 December 2013 est.)
* country comparison to the world: 105
Stock of narrow money:
$2.666 billion (31 December 2014 est.)
$2.562 billion (31 December 2013 est.)
* country comparison to the world: 121
Stock of broad money:
$12.6 billion (31 December 2014 est.)
$12.15 billion (31 December 2013 est.)
* country comparison to the world: 99
Stock of domestic credit:
$16.27 billion (31 December 2014 est.)
$14.9 billion (31 December 2013 est.)
* country comparison to the world: 89
Market value of publicly traded shares:
$7.093 billion (31 December 2012 est.)
$7.667 billion (31 December 2011)
$7.442 billion (31 December 2010 est.)
* country comparison to the world: 81
Current account balance:
-$1.108 billion (2014 est.)
-$1.179 billion (2013 est.)
* country comparison to the world: 125
Exports:
$3.135 billion (2014 est.)
$2.872 billion (2013 est.)
* country comparison to the world: 130
Exports – commodities:
clothing and textiles, sugar, cut flowers, molasses, fish, primates (for research)
Exports – partners:
UK 16.9%, France 15%, US 10.1%, Italy 8.9%, South Africa 8.4%, Madagascar 6.2%, Spain 5.8% (2013)
Imports:
$5.441 billion (2014 est.)
$5.141 billion (2013 est.)
* country comparison to the world: 126
Imports – commodities:
manufactured goods, capital equipment, foodstuffs, petroleum products, chemicals
Imports – partners:
India 24.3%, China 14.7%, France 8.2%, South Africa 6.2% (2013)
Reserves of foreign exchange and gold:
$4.018 billion (31 December 2014 est.)
$3.491 billion (31 December 2013 est.)
* country comparison to the world: 101
Debt – external:
$5.7 billion (31 December 2014 est.)
$5.229 billion (31 December 2013 est.)
* country comparison to the world: 122
Stock of direct foreign investment – at home:
N/A
Stock of direct foreign investment – abroad:
N/A
Exchange rates:
Mauritian rupees (MUR) per US dollar –
30.43 (2014 est.)
30.703 (2013 est.)
30.05 (2012 est.)
28.706 (2011 est.)
30.784 (2010 est.)
Location:
Southern Africa, island in the Indian Ocean, about 800 km (500 mi) east of Madagascar
Geographic coordinates:
20 17 S, 57 33 E
Map references:
Africa
Area:
total: 2,040 sq km
land: 2,030 sq km
water: 10 sq km
note: includes Agalega Islands, Cargados Carajos Shoals (Saint Brandon), and Rodrigues
* country comparison to the world: 181
Area – comparative:
almost 11 times the size of Washington, DC
Land boundaries:
0 km
Coastline:
177 km
Maritime claims:
measured from claimed archipelagic straight baselines
territorial sea: 12 nm
exclusive economic zone: 200 nm
continental shelf: 200 nm or to the edge of the continental margin
Climate:
tropical, modified by southeast trade winds; warm, dry winter (May to November); hot, wet, humid summer (November to May)
Terrain:
small coastal plain rising to discontinuous mountains encircling central plateau
Elevation extremes:
lowest point: Indian Ocean 0 m
highest point: Mont Piton 828 m
Natural resources:
arable land, fish
Land use:
arable land: 37.44%
permanent crops: 1.97%
other: 60.59% (2012 est.)
Irrigated land:
212.2 sq km (2003)
Total renewable water resources:
2.75 cu km (2011)
Freshwater withdrawal (domestic/industrial/agricultural):
total: 0.73 cu km/yr (30%/3%/68%)
per capita: 568.2 cu m/yr (2003)
Natural hazards:
cyclones (November to April); almost completely surrounded by reefs that may pose maritime hazards
Environment – current issues:
water pollution, degradation of coral reefs
Environment – international agreements:
party to: Antarctic-Marine Living Resources, Biodiversity, Climate Change, Climate Change-Kyoto Protocol, Desertification, Endangered Species, Environmental Modification, Hazardous Wastes, Law of the Sea, Marine Life Conservation, Ozone Layer Protection, Ship Pollution, Wetlands
signed, but not ratified: none of the selected agreements
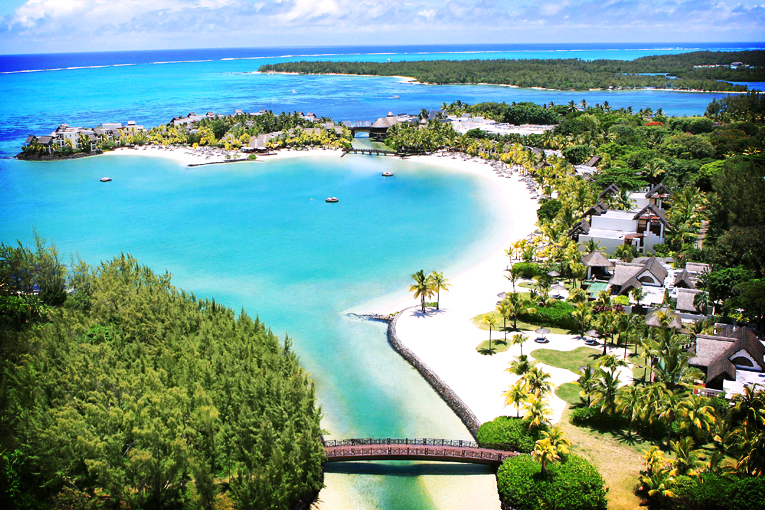
Geography – note:
the main island, from which the country derives its name, is of volcanic origin and is almost entirely surrounded by coral reefs; former home of the dodo, a large flightless bird related to pigeons, driven to extinction by the end of the 17th century through a combination of hunting and the introduction of predatory species.
| Title | |||
|---|---|---|---|
| No Packages Found | |||
 | Mr. Prakash Kowlesser | Designation | +230 213 0654 | |
| Ms Kreshny GURIAH | Project Officer | +230 201 3914 | |
| Mrs Zaheda Begum | Principal Assistant | +230 201 1219 | |
| Mr. Bhaguthsing BEERACHEE | Senior Project Officer | +230 201 1360 | |
| Mr. Parvin Kumar | Ministry of Health | +230 674 5492 | |
| Mr. Purdhun I. A. Shanawaz | Environment Officer | +230 203-6200 | |
| Mrs Bibi Yashria Korimboccus | Solid Waste Management |